Key Takeaways:
- Value Stream Mapping facilitates a shared understanding among team members by aligning their views on workflows and challenges. This collaborative approach fosters commitment to change and enhances overall team dynamics.
- Implementing VSM involves three key phases: identifying components of the value stream, overlaying key measurement items, and visualizing the map to synthesize insights.
- Use cases demonstrate the transformative potential of VSM in improving workflows and delivering greater value to organizations.
In the dynamic realms of product management and user experience (UX) design, tools that streamline processes, identify inefficiencies, and maximize value are invaluable. One such tool, Value Stream Mapping (VSM), has gained significant traction for its ability to visualize and optimize workflows. This article explores the objectives of VSM, its key components, practical steps for implementation, and how it can transform processes in product management and UX design.

Figure 1: Key Objectives of Value Stream Mapping are getting everyone on the same page, looking at the problem collectively through the same lens, and agreeing on the path forward through their respective fulfillment paths.
The primary objectives of VSM are:
1) Unified perspective – Ensures everyone views the problem through the same lens, aligning the team's understanding of workflows and challenges.
2) Consensus on problems – Facilitates agreement on identified issues, making it easier for teams to focus on critical inefficiencies.
3) Agreement on solutions – Aids in reaching a consensus on the best solutions to address identified problems, fostering collaboration and commitment to change.
What is value stream mapping?
Value Stream Mapping is a lean-management tool that helps visualize and understand the flow of materials and information required to bring a product or service from conception to delivery. While originally developed for manufacturing, VSM has found utility in various fields, including software development, healthcare, and service industries.
Implementation of value stream mapping
There are 3 key phases to implementing a value stream map.
Phase 1 – Identifying all the components needed to build the map
Phase 2 – Overlaying and tracking key measurement items
Phase 3 – Visualizing and synthesizing the map
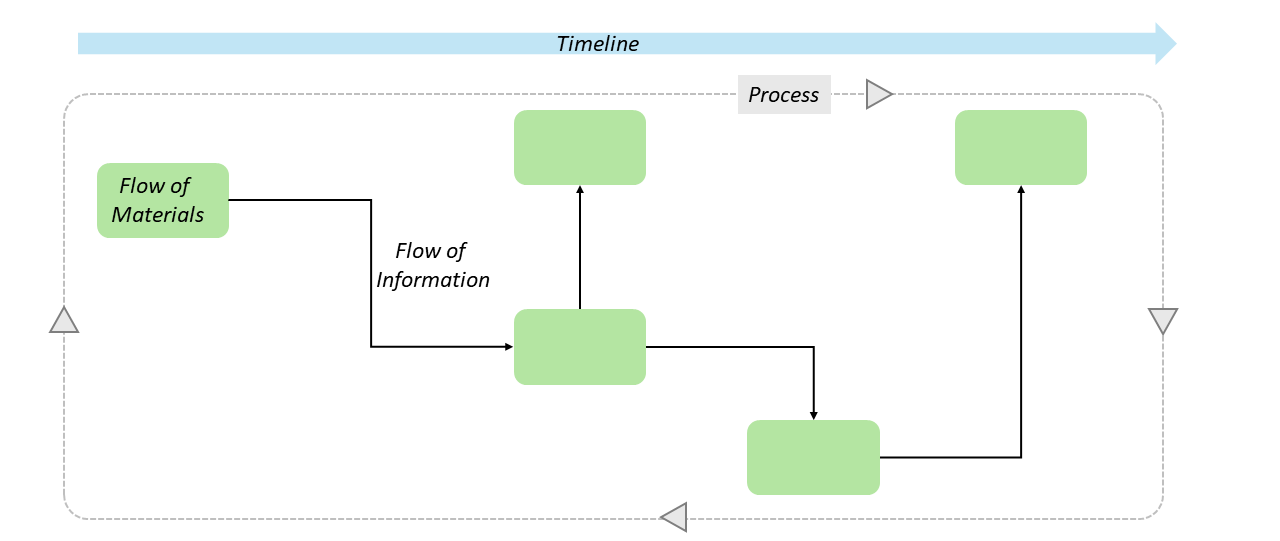
This is the first and perhaps the most foundational stage of building out the map. It consists of several key items around processes, flows and timelines.

Figure 2: Components of a value stream map
1) Processes – Steps involved in creating a product or service, from initial conception to final delivery. For example, in software development, the processes might include requirements gathering, design, development, testing and deployment.
- Value-added activities – Actions that directly contribute to delivering value to the customer.
- Non-value-added activities – Steps that do not enhance the product or service and can be eliminated or minimized.
2) Flow of materials – Tracks the physical movement of raw materials and products through the process. For instance, in e-commerce, this may include the sequence from Customer Order to Delivery.
3) Flow of information – Depicts how information moves to facilitate process steps. For a SaaS product, this may involve Customer Feedback leading to Feature Requests, which are then prioritized for development.
4) Timeline – Includes the time taken for each process step and the overall lead time, allowing teams to visualize delays and areas for improvement.
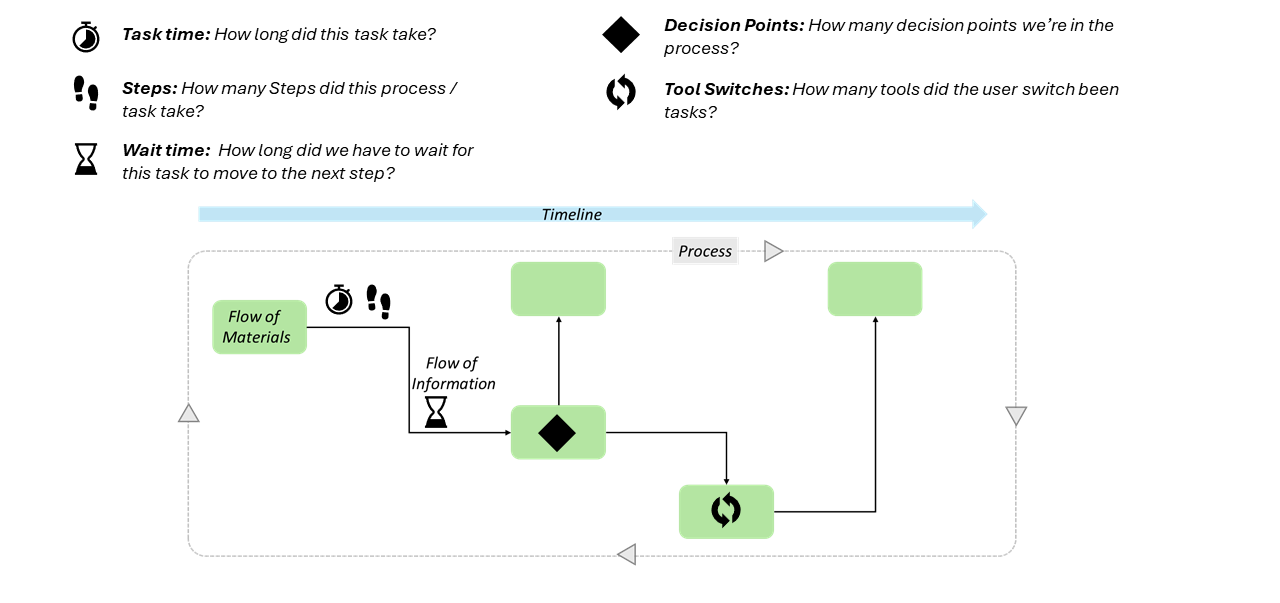
Once our foundational maps have been built, it’s time to start measuring some key items. Deciding what these items are will vary from map to map and process to process, but the key measures are explained below.

Figure 3: Items to track in a value stream map
Step-by-step guide to track key items
To effectively implement VSM, teams should focus on tracking the following key items:
1) Steps
- Definition – Identify and document every step involved in the process from start to finish.
- Action – Break down the workflow into individual steps and create a flowchart to visualize these steps.
Example – In a software development context, steps may include requirements gathering, design, development, testing and deployment.
2) Tool switches
- Definition – Identify points where the process requires switching between different tools or platforms.
- Action – Map out tool transitions throughout the process, identifying any delays caused by these switches.
Example – Switching from a design tool like Sketch to a development environment like GitHub may introduce inefficiencies.
3) Decision points
- Definition – Mark the points in the process where decisions are made that can affect the flow.
- Action – Identify key decision points and analyze the time taken for these decisions, streamlining where possible.
Example – Approval stages in product development, such as design sign-offs, can often create bottlenecks.
4) Task time
- Definition – Measure the time taken to complete each task within the process.
- Action – Record start and end times for each task, calculating average times to identify longer-than-expected durations.
Example – The time taken to develop a new feature or conduct usability tests can be tracked to identify areas for improvement.
5) Wait time
- Definition – Measure the time spent waiting between tasks or steps in the process.
- Action – Track idle times and analyze their causes, implementing strategies to reduce wait times.
Example – Waiting for stakeholder feedback during the design phase can lead to delays.
Example – Impact of VSM on workflow optimization
Sales order process example and scenario
- Sales associate salary – $50 per hour
- Number of associates – 20
- Current sales order process time – 30 minutes per order
- Orders processed per month per associate – 250
- Reduced order process time after VSM – 15 minutes per order
By reducing the sales order process time from 30 minutes to 15 minutes, each sales associate saves approximately 750 hours per year. For a team of 20 associates, this results in a total savings of 15,000 hours per year, equating to a cost saving of $750,000 annually. This illustrates how small-time savings can lead to substantial efficiency gains across a large team.
Certification requests workflow example
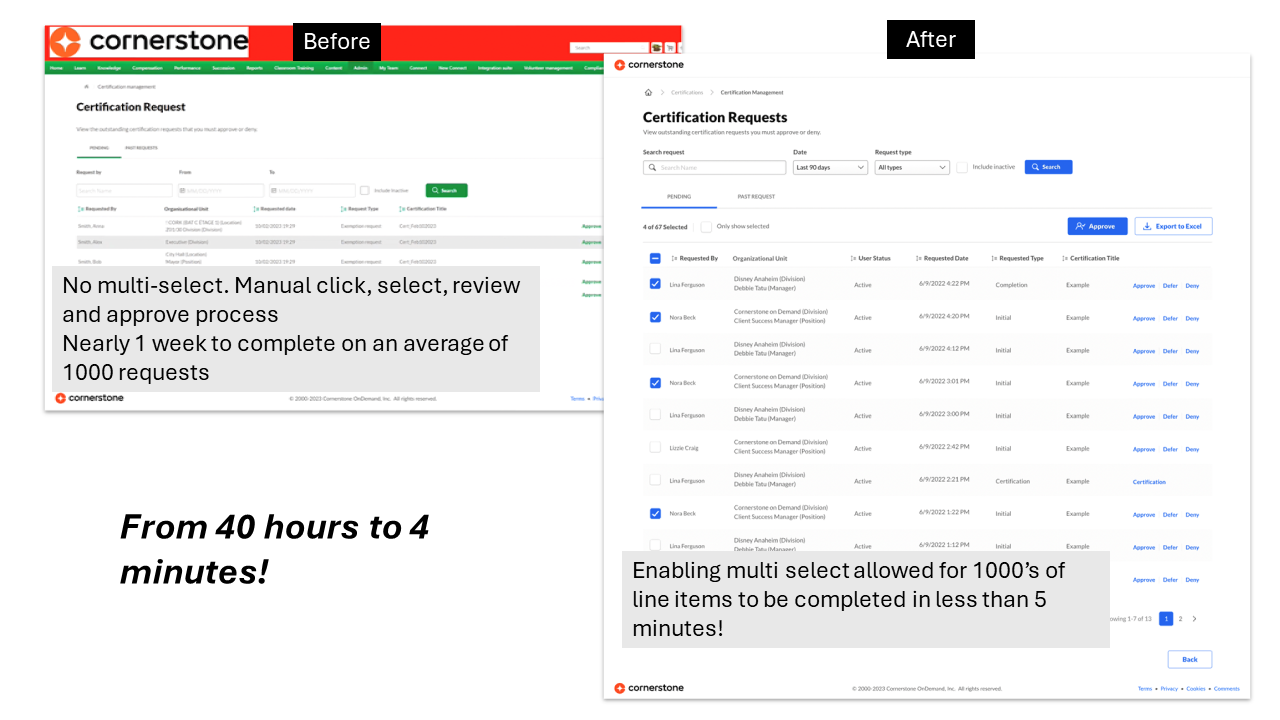
Here's another example that hits closer to home — with our "Certification Requests" workflow that saw a massive uptake. The erstwhile experience took one full-time person one week to manually approve over 1000 requests. With the improved experience, as we looked through various processes and identified manual steps, we streamlined it with a bulk approval feature which now takes just 4 minutes to approve thousands of requests.
Scenario
- Employee salary – $50 per hour
- Current approval process time – 40 hours per 1000 requests (1 week)
- Improved approval process time – 4 minutes per 1000 requests
By reducing the approval process time from 40 hours to 4 minutes for 1000 requests, the employee saves approximately 2076 hours per year. At an hourly wage of $50, this results in a cost saving of approximately $103,800 annually.
Now, imagine this benefit scaled across an organization with hundreds or thousands of users. For example, if 500 employees each save 2076 hours per year, the total savings would be 1,038,000 hours annually. At $50 per hour, this translates to a staggering $51,900,000 in annual savings.

Figure 4: 40 hours to 4 mins! How minor changes add up significantly!
Once we’ve had a good view of the flows and have overlaid all the critical measures to track; the next phase involves visualizing and drawing conclusions.
Key action items
1) Form a cross-functional team – Assemble representatives from product management, UX design, development, and quality assurance to map the current process.
2) Conduct workshops – Hold workshops to collaboratively map out the current state value stream, documenting every step, tool switch, decision point, task time, and wait time.
3) Create a current state map – Visualize the entire process from requirements gathering to deployment, highlighting inefficiencies and delays.
4) Analyze and identify bottlenecks – Use the current state map to pinpoint the primary causes of delays, such as unclear requirements and redesigns.
5) Develop future state map – Design a streamlined process that addresses these inefficiencies by implementing clearer requirements-gathering processes and better stakeholder communication.
6) Implement changes – Roll out the changes and continuously monitor the process to ensure improvements are realized.

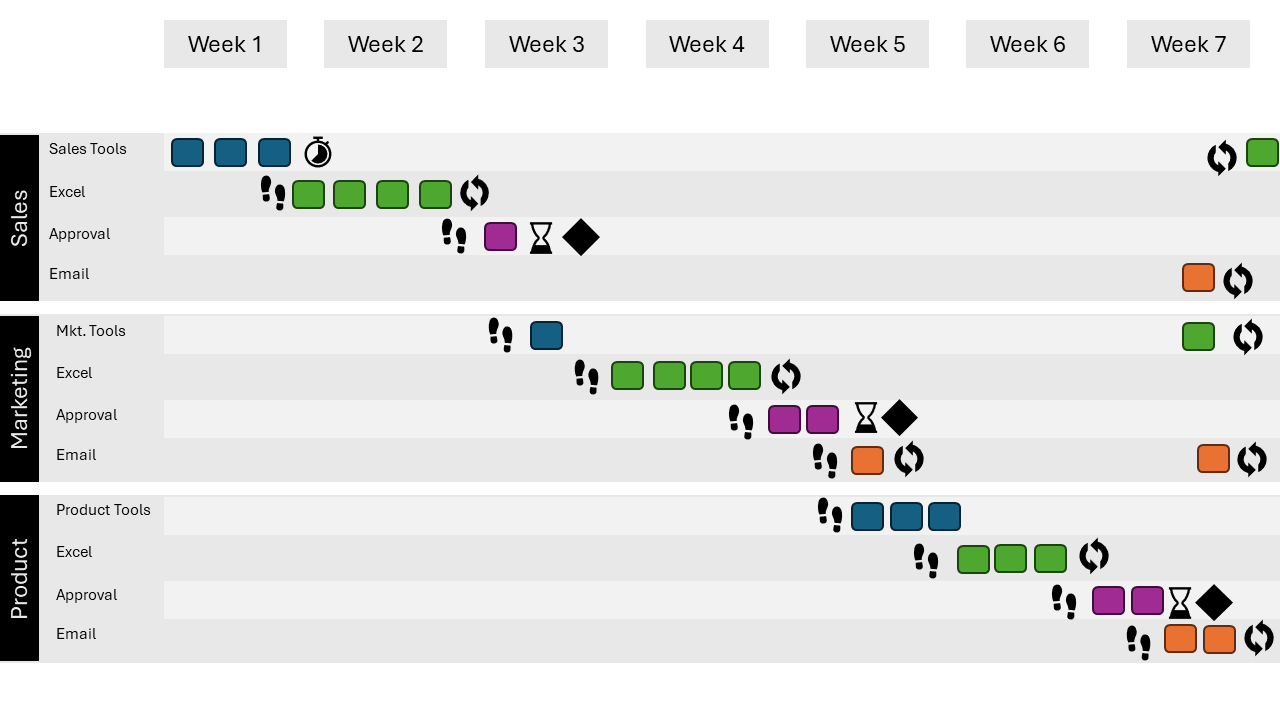
Figure 5: A sample view of a VSM, which shows all items in Green using manual tracking in Excel, decision points in purple and highlights the number of tools switched. All these items are opportunities for workflow improvement or automation.
The illustration above tells us the number of times our tools switched and to what tools, how long processes take, the number of steps, how many times decisions were made etc. Collectively, the teams can first agree that this is an issue and then agree to solve it collectively. Once this is done, a new map with the proposed changes is created to compare a before and after and calculate the benefits of time and cost saved. It’s important to note that the net benefit of it should be considered and not just the individual measures.
Steps may increase, but this may reduce decision-making and wait times. Sometimes, more decision points may be introduced, but this will minimize tool switching and task time. In other instances, a new tool may be introduced, which may significantly increase tool switches but eliminate wait time and decision-making. Therefore, looking at it holistically allows us to measure and manage our outcomes effectively.
Value stream mapping (VSM) is a transformative tool for product management and UX design. It enables teams to visualize processes, identify inefficiencies, and reach a consensus on solutions. By applying VSM, organizations can enhance their workflows, reduce waste, and deliver greater value to customers.
Implementing VSM involves a structured approach, focusing on key items such as steps, tool switches, decision points, task time, and wait time. By following these practical steps, teams can begin using VSM immediately and realize significant improvements in their processes.
The examples of sales order processing and certification requests illustrate the significant impact of VSM on streamlining workflows and achieving substantial efficiency gains. Through collaboration and continuous improvement, organizations can optimize workflows and foster a culture of excellence in product management and UX design.


